
New this year: exact parity.
For each pair, a man and a woman.
In addition, the elections were no longer called cantonal, but departmental.
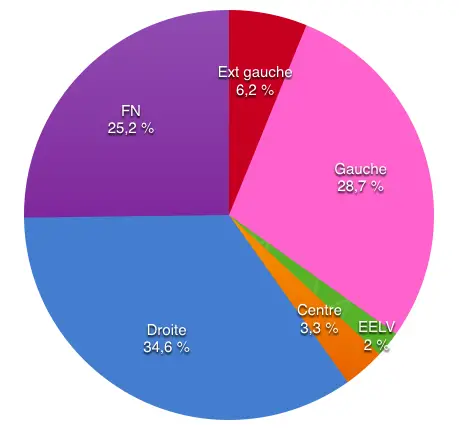
The official results of the 1st round of the legislative elections are in.
The abstention rate was 49.83%.
| Binomials of candidates | Votes | registrants | % Votes cast |
|---|---|---|---|
| Binomial Extreme left | 14,723 | 0.03 | 0.07 |
| Left Front Binomial | 962,394 | 2.25 | 4.72 |
| Left Party Binomial | 12,027 | 0.03 | 0.06 |
| Binomial of the French Communist Party | 269,285 | 0.63 | 1.32 |
| Socialist Party Binomial | 2,708,427 | 6.34 | 13.30 |
| Binomial Union of the Left | 1,663,466 | 3.90 | 8.17 |
| Radical Left Party Binomial | 62,372 | 0.15 | 0.31 |
| Various binomial left | 1,383,318 | 3.24 | 6.79 |
| Binomial of Europe-Ecologie-Les Verts | 412 729 | 0,97 | 2,03 |
| Binomial Miscellaneous | 271,065 | 0.63 | 1.33 |
| Binomial of the Modem | 72,410 | 0.17 | 0.36 |
| Binomial Union du Centre | 58 985 | 0,14 | 0,29 |
| Union Démocrates et Indépendants Binomial | 263 209 | 0,62 | 1,29 |
| Binomial Union for a Popular Movement | 1,339,412 | 3.14 | 6.57 |
| Binomial Union of the Right | 4,254,050 | 9.96 | 20.88 |
| Binomial Debout la France | 81 971 | 0,19 | 0,40 |
| Various binomial right | 1,386,466 | 3.25 | 6.81 |
| National Front Binomial | 5,141,897 | 12.04 | 25.24 |
| Extreme Right Binomial | 13,382 | 0.03 | 0.07 |
>